Sacramento Water Hardness by District
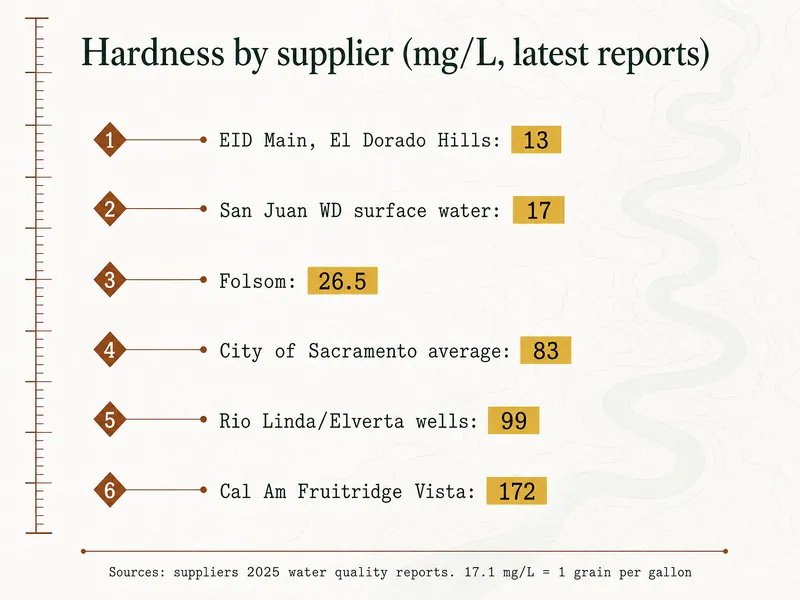
Sacramento water hardness by district runs from 13 mg/L in El Dorado Hills to 172 mg/L in Cal Am's Fruitridge Vista system, according to each supplier's latest water quality report.
Checked against its sources by Levee Line · how figures are sourced · Last checked
Ownership note: Levee Line shares its owners with SoftPro Water Systems and Quality Water Treatment, the two stores this page links to. Figures on this page come from Sacramento-area suppliers' own 2025 water quality reports, California and federal rules and certifiers' listings, read in October 2026. Anything a store says about its own product is reported as the store's claim. How store links work here
Readings first
- Lake-fed suppliers are soft: EID Main 13 mg/L, San Juan Water District's treated water 17, Folsom 26.5 and Roseville's Folsom Lake supply 26 (2025 reports).
- The City of Sacramento reports 83 mg/L, or 4.9 gpg, as its system average in its 2025 report.
- California American Water's Sacramento systems are the hardest: 96 to 172 mg/L system averages.
- Several suppliers print only source values, so a home's tap figure falls between their surface-water and well numbers.
- West Sacramento's newest posted report is for 2024; it gives 47 mg/L (17.1–180).
- To get grains per gallon, divide mg/L by 17.1, the factor written into California Health and Safety Code 116780.
Which Sacramento districts have soft water?
Every supplier whose water comes mainly from Folsom Lake or the American River reports under 60 mg/L, the top of the USGS soft band. El Dorado Irrigation District's Main System report gives 13 mg/L (0.76 gpg) for El Dorado Hills. The San Juan wholesale agencies' joint 2025 report gives 17 mg/L for San Juan's treated lake water, which is all Orange Vale Water Company delivers.
Folsom reports 26.5 mg/L for its main system and 29 for Ashland. Roseville's 2025 report gives 26 mg/L for its Folsom Lake water, with wells averaging 95 (31–280) when wells are in use. Carmichael Water District's river water is 25 ppm.
Two more fall in the soft band on river water. The Sacramento County Water Agency's North Service Area (Mather, Sunrise, Anatolia) is about 99% surface water at roughly 52–55 mg/L. West Sacramento's most recent posting, a 2024 report, averages 47 ppm; that report calls 47 ppm "slightly hard", though on the USGS scale it is soft.
Which Sacramento districts have the hardest water?
California American Water's well-fed systems top the list: Parkway averages 166 mg/L and Fruitridge Vista 172, both in the USGS hard band, with single readings up to 310 and 340. Its Suburban-Rosemont, Antelope, Arden and Lincoln Oaks systems average 96 to 124. All six reports sit on Cal Am's water quality reports index.
Sacramento Suburban Water District's own wells average 120 mg/L in the north service area and 130 in the south, with readings up to 240 and 280 in its 2025 report. Rio Linda/Elverta, on wells alone, averages 99 mg/L (67–140). Golden State Water's Cordova system, serving Rancho Cordova and Gold River, averages 75 mg/L but ranges from 25 to 270, which shows how far a blended system can swing.
Hardness extremes in the region
- 13 mg/LSoftest reading: EID Main System, 2025EID water quality report
- 17 mg/LSan Juan WD treated Folsom Lake water (2025)San Juan Water District
- 75 mg/LCordova system average, swinging from 25 to 270Golden State Water Company
- 172 mg/LCal Am Fruitridge Vista average (2025)California American Water
Why do source and tap figures differ?
Because many suppliers mix soft lake or river water with harder well water, and they report each source separately rather than what reaches a given tap. Citrus Heights Water District is about 94% San Juan lake water at 17 mg/L and 6% wells averaging 137.5, so a home there gets something between 17 and 137.5 depending on the blend. Fair Oaks Water District runs about 12.3% wells, averaging 84.5 mg/L.
Sacramento Suburban says its customers "may receive only surface water, groundwater, or a blend of both", so tap hardness moves through the year. The County Water Agency's Laguna and Vineyard area is about 65% surface water at 55 mg/L, with wells ranging 9.1 to 160. Carmichael describes a seasonal swing too: soft river water through winter, then well water from May to October that its report puts anywhere from 53 to 210 ppm.
How do you convert mg/L to grains per gallon?
Divide the mg/L figure by 17.1. California's softener law defines it this way: "One grain of hardness per gallon is approximately equivalent to 17.1 milligrams of hardness per liter" (Health and Safety Code 116780). Reports print ppm, which equals mg/L, and list trace contaminants in ppb and ppt.
Worked through: 13 mg/L is 0.8 gpg, 83 mg/L is 4.9 gpg, 130 mg/L is 7.6 gpg and 172 mg/L is 10.1 gpg. Softener settings and sizing use grains, so this conversion is the first step on water softener sizing. One oddity: Woodland's 2025 report prints its 69.4 average as "ppb", but its own 4.06 gpg figure shows it means mg/L.
Which districts don't publish a tap figure?
Elk Grove Water District is the gap: its report could not be opened for this page, so no figure is shown here. The district posts an annual report of its own, which is where its current number lives.
The San Juan wholesale family (Citrus Heights, Fair Oaks), Sacramento Suburban and the County Water Agency print values by source only. For those, read the range as "between the surface figure and the well figure, depending on the blend". Davis prints a weighted average of 72 ppm, a number its report says rarely exceeds 100 ppm, but single wells reach 510. Finding which supplier bills you comes first: see finding your water district, then how to read a water quality report.
When does hardness justify a softener?
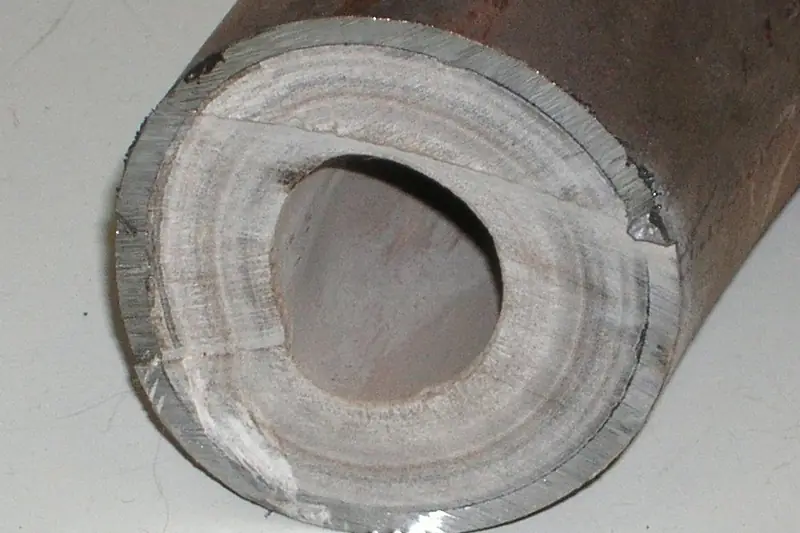
Usually when the number for your supply, or its well number if wells feed your street, tops roughly 120 mg/L, about 7 grains, and spotting or heater scale is a real annoyance. On the soft lake-fed systems a salt softener rarely pays its way. Davis and Woodland, whose water dropped from about 18 gpg to about 4 when river water arrived, now ask residents to consider bypassing softeners or turning them down.
For harder groundwater areas, SoftPro sells the SoftPro ECO City Water Softener (sold by SoftPro Water Systems, which shares Levee Line's owners) in 32,000- to 64,000-grain sizes (the store's listed price in October 2026: $967–$2,677), and Quality Water Treatment lists the same SoftPro ECO softener (sold by Quality Water Treatment, which shares Levee Line's owners) at the same range. A softener treats hardness only: it does nothing for bacteria, nitrate, arsenic or chromium 6. The decision steps are on do you need a water softener.
Sounding notes
Figures come from each supplier's latest consumer confidence report, read in October 2026: 2025 reports for the City of Sacramento, Sacramento Suburban, the San Juan wholesale agencies, Carmichael, Folsom, Roseville, El Dorado Irrigation District, Sacramento County Water Agency, Golden State Water (Cordova), Rio Linda/Elverta, California American Water, Davis and Woodland; West Sacramento's 2024 report. Bands use the USGS scale. Left out: Elk Grove Water District (report not readable), smaller County Water Agency and Cal Am systems not pulled, and any blended tap value a supplier does not print.
Downstream questions
Which Sacramento-area supplier has the softest water?
El Dorado Irrigation District's Main System, at about 13 mg/L (0.76 gpg) in its 2025 report. San Juan's treated Folsom Lake water is close behind at 17 mg/L.
Is Rancho Cordova water hard?
Golden State Water's Cordova system averages 75 mg/L, moderately hard, but its 2025 report shows a range of 25 to 270 mg/L because it blends wells with treated surface water. Parts of Rancho Cordova are served by the County Water Agency's North Service Area instead, at about 52 to 55 mg/L.
Is Citrus Heights water hard?
Mostly not: about 94% comes from San Juan's lake water at 17 mg/L. The district's own wells average 137.5 mg/L, so tap water can be harder when they run.
Why does Cal Am water vary so much between systems?
Each Cal Am system draws on different wells, some topped up with purchased surface water. Arden ranges 33 to 240 mg/L and Fruitridge Vista 52 to 340, so the system average hides wide swings.
Does Roseville water get harder in summer?
Roseville's water is mainly Folsom Lake water at 26 mg/L. Its wells average 95 mg/L and are used as backup or blend, so hardness rises only when wells are in use.
Is Elk Grove water hard?
That depends on the supplier. Laguna and Vineyard customers of the County Water Agency get about 55 mg/L surface water and wells averaging 44. Customers of Elk Grove Water District should look up that district's own annual report.
Further down the channel
Back upstream: Sacramento tap water, supplier by supplier