How to Read a Sacramento Water Quality Report
A Sacramento water quality report lists only what was detected: compare each row's average and range with its MCL, then check the hardness, lead and unregulated tables.
Checked against its sources by Levee Line · how figures are sourced · Last checked

Readings first
- Every community water system publishes a yearly Consumer Confidence Report; the City of Sacramento's 2025 edition was published June 1, 2026 and covers 2025 data.
- The City tests for more than 100 substances but its tables list only those detected at or above reporting levels.
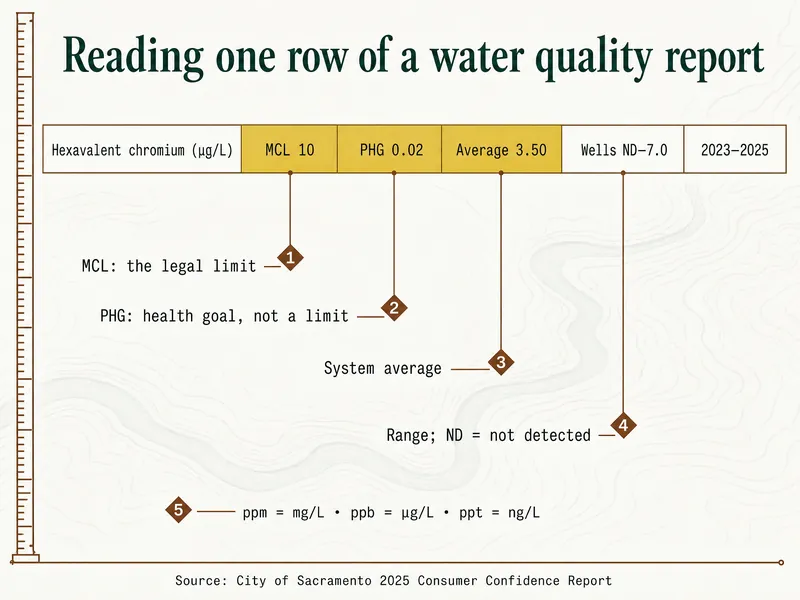
- An MCL is the legal limit; a PHG is a California health goal, often far lower (hexavalent chromium: MCL 10 µg/L, PHG 0.02 µg/L).
- Hardness sits in the "other parameters" table, not the health table: 83 mg/L (4.9 gpg) for the City system in 2023–2025 samples.
- Lead is judged at the 90th percentile of home tap samples against a 15 µg/L action level, which EPA's LCRI lowers to 10 µg/L by November 1, 2027.
- Reports print ppm, ppb and ppt: ppm equals mg/L, ppb equals µg/L and ppt equals ng/L.
What the City of Sacramento's 2025 report prints
- 100+substances tested for; only detections are listedCity of Sacramento 2025 CCR
- 56homes in the City's 2023 lead and copper sampling, none over the action levelCity of Sacramento 2025 CCR
- 4.0 mg/Lmaximum chlorine residual allowed (MRDL); the City averaged 0.8City of Sacramento 2025 CCR
- 10 µg/LCalifornia's hexavalent chromium MCL, effective October 1, 2024State Water Board
What is in a Sacramento water quality report?
A Sacramento water quality report, formally a Consumer Confidence Report (CCR), lists where the water comes from, every substance detected in the year's testing, and the legal limit for each. The 2025 editions read for this site came out between May and July 2026.
The City of Sacramento's 2025 report runs 11 pages. It opens with sources (about 80% river water, 20% wells), then a source water assessment, required health language, three data tables, and notes on lead, algal toxins, taste and PFAS. The other reports read for this site follow a similar order.
Two habits make reading easier. First, check the year printed on each row: the City notes that some substances are tested less than once a year, so a 2025 report can include 2023 data. Second, read the footnotes, because that is where units, compliance methods and typos get explained. West Sacramento's latest posted report is still the 2024 edition, so its numbers are a year older than its neighbors'.
What do MCL, PHG and DLR mean?
The MCL is the highest level allowed in drinking water; the PHG is the level below which there is no known or expected health risk; the DLR is the level at or above which a lab must report a detection. Those definitions are quoted from the Sacramento County Water Agency's 2025 report, which also notes that primary MCLs are set "as close to the PHGs (or MCLGs) as is economically and technologically feasible."
The gap between the two can be large. The City's arsenic row shows an MCL of 10 µg/L and a PHG of 0.004 µg/L; its hexavalent chromium row shows 10 and 0.02. A result between the PHG and the MCL is legal. A PHG is set by California's environmental protection agency; the MCLG is the federal equivalent from the U.S. EPA.
You will also meet MRDL (the limit for a disinfectant, 4.0 mg/L for chlorine), AL (action level, used for lead and copper), TT (treatment technique), NL and RL (notification and response levels for unregulated chemicals), and ND, meaning not detected at the reporting limit. ND does not mean zero.
How do you read the source columns?
Source columns show each supply separately, so you can see what your area gets before the water mixes. The City's tables have four value columns: system average, the E.A. Fairbairn plant (American River), the Sacramento River plant, and City groundwater.
Read across a row and the differences jump out. Total dissolved solids run 47 mg/L at Fairbairn, 110 at the Sacramento River plant and 180–280 in City wells, against a 205 system average. Hexavalent chromium is not detected at Fairbairn, 0.1 µg/L at the river plant and up to 7.0 µg/L in wells.
Some reports print only source values with no blended figure. The San Juan joint report gives surface water 17 mg/L hardness and Citrus Heights wells 100–170 mg/L, so a Citrus Heights tap falls somewhere between, depending on the blend. SCWA uses a weighted average, in which each source counts by how much water it supplied.
Where is hardness in the report?
Hardness appears in the "other parameters" or "unregulated" table, because it has no health-based MCL. The City's 2025 report prints it twice, in mg/L and in grains per gallon: a system average of 83 mg/L (4.9 gpg), 34 (2.0 gpg) at Fairbairn, 63 (3.7 gpg) at the Sacramento River plant and 15–154 (0.9–9.0 gpg) in wells.
When a report gives only mg/L (or ppm), divide by 17.1 for grains. Roseville's 2025 report lists Folsom Lake water at 26 mg/L, about 1.5 gpg, and its wells at 95 mg/L on average.
Watch for unit slips. Woodland's 2025 report prints hardness as "69.4 ppb," but its own 4.06 gpg figure shows it means mg/L. Compare whatever number you find with the USGS hardness scale (0–60 soft, 61–120 moderately hard, 121–180 hard), then see hardness by water district.
How do you read the lead and copper rows?
Lead and copper rows report the 90th-percentile result from home taps, the number of homes sampled and how many were over the action level. The City's row reads: 56 samples collected in 2023, 90th percentile not detected, and no home above the 15 µg/L action level. Copper's 90th percentile was 0.06 mg/L against a 1.3 mg/L action level.
A system can pass with a few high homes. El Dorado Irrigation District's 2025 report shows 3 of 55 homes above the lead action level in 2023 while the system stayed in compliance, because the 90th-percentile result was not detected. The City's report notes that lead in drinking water comes mainly from service lines and home plumbing, not from the treatment plant.
The sampling year often lags: lead rows in the 2025 reports range from 2023 to 2025 data. Service line inventories now sit next to these rows; the City's says no lead or galvanized-requiring-replacement lines were found in 2024. For what to do at your own tap, see lead in Sacramento tap water.
What do unregulated results mean?
Unregulated results are chemicals tested under federal or state programs that have no enforceable limit yet, or a limit not yet in force. Many come from EPA's fifth Unregulated Contaminant Monitoring Rule (UCMR5), which covered 29 PFAS and lithium. The City lists lithium at not detected to 25.4 µg/L in its wells (2023–2024).
PFAS are the rows most people look for. Sacramento Suburban WD's 2025 report shows low detections such as PFOS up to 2.0 ng/L in the north; California's notification level for PFOS is 4 ng/L. EPA's 2024 limits of 4.0 ppt for PFOA and PFOS stand, but EPA proposed on May 18, 2026 to allow compliance until 2031 and to rescind four other PFAS limits; that is a proposal, not a final rule.
A row with no limit is not automatically a problem. Compare the result with its notification level, if one is printed, and read the footnote. The chromium 6 and PFAS page tracks each supplier's results.
Sounding notes
This page works through the City of Sacramento's 2025 Consumer Confidence Report as its example, with definitions quoted from Sacramento County Water Agency's 2025 Central/South report and comparison rows from the San Juan joint, Roseville, Woodland, El Dorado Irrigation District and Sacramento Suburban WD 2025 reports. Rules come from the State Water Board's chromium 6 and PFAS pages and EPA's PFAS and LCRI pages, all read in October 2026. Left out: health effects of individual substances beyond what the reports print, and any value a report does not publish, such as City PFAS results.
Downstream questions
Why does a report list chemicals with unfamiliar names?
Reports must list every regulated or monitored substance that was detected, even at trace levels. Trihalomethanes and haloacetic acids, for example, are by-products of chlorine disinfection; the City's 2025 averages were 63 and 29 µg/L against limits of 80 and 60.
What does "ND" mean on a water quality report?
ND means not detected at or above the detection limit for reporting. It does not prove zero; it means any amount present was below what the lab is required to report.
Why do some rows show data from two or three years ago?
The state lets systems sample some substances less than once a year when levels change slowly. The City's 2025 report says some of its data, "though representative," are more than one year old.
What is a weighted average?
It is an average in which each source counts by how much water it delivered. SCWA uses it so a small well does not count as much as a large treatment plant.
Where can I find last year's report?
Usually on the same page as the current one. SCWA, for example, lists its 2024 reports under "Past Reports", and the City of Sacramento says each edition stays current until the next is published.
Does a secondary MCL exceedance mean the water is unsafe?
No. Secondary MCLs cover taste, odor and appearance. Roseville's 2025 report shows an odor result above the secondary limit for its Folsom Lake source, which is an aesthetic result, not a health violation.
Further down the channel


Back upstream: every Sacramento-region tap water reading